


Every service business has paid hours that don’t produce revenue. A technician waits on a part, or a gap opens between two jobs on opposite sides of town. With three technicians, you can see it happening. With ten or fifteen, you can’t, and the cost adds up before anyone notices. This guide shows how to reduce idle time for field technicians. Measure it first, then fix the scheduling and information gaps that cause it.
Quick Answer: How do you reduce technician idle time in field service?
Start by measuring it: track each technician’s drive time, time on site, and gaps between jobs for two weeks. Then close the gaps by grouping jobs by area, dispatching the closest available technician, confirming appointments to prevent no-shows, and sending technicians to each job with the parts and information they need. Use live location and idle data from GPS fleet tracking to review results weekly and adjust your schedule.
What Is Technician Idle Time?
Technician idle time is paid time that a field technician doesn’t spend on productive work. It includes gaps between jobs, waiting at a job site, parts runs, and admin. It applies to every trade that works from vehicles, including HVAC, plumbing, electrical, appliance repair, and garage door businesses.
Vehicle idling is a separate problem: an engine running while the vehicle is parked or stopped. It wastes fuel and adds engine wear, and it’s easy to overlook because it happens in small chunks. A business needs to manage both. This guide focuses mainly on paid technician idle time, which is usually the higher cost, and then covers engine idling, where GPS fleet tracking can help reduce fuel waste.
Idle Time, Utilization, and Wrench Time
Three terms come up whenever owners talk about technician productivity.
- The technician utilization rate compares billable hours to total paid hours. Our guide to HVAC business management explains why a low utilization rate often points to a scheduling problem rather than a workforce problem.
- Wrench time is the share of a technician’s workday spent doing hands-on work on the job. It’s a stricter measure than utilization because drive time, waiting, and admin all count against it.
- Windshield time is time spent driving between jobs. It’s the largest part of the gap between paid hours and wrench time for most mobile teams.
Our booking rate guide includes a related metric that indicates how full your schedule is.
What Does Technician Idle Time Cost?
Published estimates of how much of a technician’s day is idle or spent driving vary widely, and most can’t be traced to a primary study. So this guide doesn’t rely on them. Here’s what you can calculate from sources you can check.
Wages. The US Bureau of Labor Statistics reports a May 2025 median wage of $30.67 an hour for plumbers, pipefitters, and steamfitters, and $29.33 an hour for heating, air conditioning, and refrigeration mechanics and installers. Using the plumber figure and 250 working days a year, the wage cost of idle time looks like this:
| Idle time per technician per day | Wage cost per technician per year | Wage cost for 10 technicians per year |
| 15 minutes | about $1,900 | about $19,200 |
| 30 minutes | about $3,800 | about $38,300 |
| 60 minutes | about $7,700 | about $76,700 |
This table measures paid time that is not producing work, not profit lost. If that idle time had been used for another billable job, the revenue impact could have been much higher.
This is a calculation from median wages, not a measured average. It also excludes payroll taxes, benefits, vehicle costs, and the revenue a technician could have earned during that time, so the true cost is higher. Swap in your own pay rates and working days.
Fuel. Argonne National Laboratory, a US Department of Energy lab, measured idling at about 0.3 gallons per hour for a car and about 1 gallon per hour for a big truck. A work van probably falls between the two. A vehicle that idles 30 minutes a day for 250 days burns roughly 37 gallons a year at the car rate, or 125 gallons at the truck rate. Multiply by your local fuel price to get the cost. Argonne also estimates that about 20 pounds of carbon dioxide are emitted per gallon burnt. Fuel matters, but the wage cost above is much larger.
Traffic. The Texas A&M Transportation Institute (TTI) found that Americans lost an average of 63 hours sitting in traffic in 2024, the highest level it has measured. TTI also reports that delays are spreading into midday and midweek, which is when technicians drive between jobs. Its Planning Time Index, which measures worst-day travel times, has risen in regions of every size. In plain terms, the slowest trips are getting slower, so drive times are harder to predict, and a schedule with no slack is more likely to fall behind.

What Causes Technician Idle Time?
Most idle time traces back to a handful of causes, and each has a direct fix.
| Cause | What it looks like | Fix |
| Gaps between jobs | Appointments are booked in the order customers called | Group jobs by area and sequence them as a route. |
| Long drives | A technician crosses town while another sits closer | Dispatch the closest technician using live location |
| Parts runs | The technician arrives without the part and leaves to get it | Stock trucks and check job history before dispatch. |
| Waiting at the job | The customer isn’t home or access isn’t arranged | Send ETA texts and confirm access in advance. |
| No-shows and cancellations | The slot is lost, and nobody fills it | Send reminders and keep a same-day waitlist. |
| Missing job information | The technician calls the office to ask what the job is | Put full details on the job record before dispatch. |
| Paperwork | Notes, photos, and invoices wait until the end of the day | Complete them on a mobile app at the job |
| Engine idling | Trucks run while parked, usually out of habit | Set an engine-off policy and review idle reports. |
How to Measure Technician Idle Time
Run this for two weeks with every technician:
- Record when each technician starts work, arrives at the first job, and finishes the last job.
- For every job, record drive time to the job, time on site, and any waiting time.
- Record time spent on admin and parts runs.
- Calculate three numbers for each technician: utilization rate (billable hours divided by hours paid), drive time as a share of the shift, and total gap time between jobs.
Doing this by hand works for a few technicians, but quickly gets slow. With GPS fleet tracking built into your field service management software, you can see the number of trips, total distance driven, total idle time, and each vehicle’s location on a map. Trip history lets you click into the route a vehicle took.
For more on how the technology works, see our explainer on GPS fleet tracking for field service management.
Do this: Pick your two busiest weeks and your two quietest weeks, and compare utilization for each. Idle time often looks very different when the schedule is full versus light, and each calls for a different fix.
How to Reduce Idle Time for Field Technicians: 9 Ways
The nine changes below work in a rough order. The first four fix how work gets scheduled and dispatched, the next three fix what happens at the job, and the last two make the changes stick through customer communication and engine idling. You don’t need to do all nine at once. Use your two weeks of measurements to pick the two or three causes costing you the most, fix those first, and measure again.
1. Group Jobs by Area
Divide your service area into zones and, where possible, book appointments in the same zone on the same day. A technician who does four jobs within a few miles spends far less time driving than one who does four jobs across the county. A field service scheduling tool with a map view makes zone-based booking much easier.
2. Sequence Jobs by Route
Book the day as a route, not a list. Put jobs in an order that minimizes backtracking, then slot in time-sensitive appointments around them. Review tomorrow’s schedule the afternoon before and move any job that obviously breaks the route.
3. Dispatch the Closest Technician
When an emergency call comes in, send the technician who is closest and can take the job without wrecking the rest of the day, not just whoever is free. Live vehicle locations turn that decision into a quick look at a map. Our post on what dispatch software does for your business covers dispatch in more detail, and training your dispatcher matters as much as the tools they use.
4. Fill the Gaps Left by Cancellations
A no-show can turn a booked slot into paid downtime unless the office can fill or reroute it quickly. Send appointment reminders and confirmations so fewer customers miss the slot, and keep a short list of customers who want an earlier appointment so you can fill cancellations the same day. Our SMS appointment reminder templates are a good starting point. Keep a short list of customers who want an earlier slot so you can fill a cancellation the same day.
5. Stop Parts Runs Before They Start
A technician who leaves the job to fetch a part loses the drive both ways, plus the wait. Stock trucks with the parts you use most, and check the job history before dispatch so the right parts are on board. For flat-rate work, an integrated price book also speeds up on-site quoting. See our Flat Rate Integration for details.
6. Send Complete Job Information
Technicians shouldn’t have to phone the office to find out what the job is. Include the customer’s issue, equipment history, access notes, and any photos on the job record before the technician leaves. Our guide to mobile apps for field service technicians covers what a good app puts in their hands.
7. Cut End-of-Day Paperwork
Notes, photos, invoices, and payments take longer when they pile up. Have technicians complete them in the mobile app at the job site, and take payment on-site with Service Fusion Payments. The time you save comes out of every technician’s day, not just one.
8. Narrow Arrival Windows and Send ETAs
A long arrival window means customers stay home all morning and still miss the technician. A text with the technician’s ETA, backed by live location data, reduces the time technicians spend waiting for customers to answer the door. Our post on contractor customer service covers on-the-way texts.
9. Cut Engine Idling
Set a simple policy: turn the engine off when parked. Argonne’s research found that idling uses more fuel than restarting the engine, and that restarting a modern vehicle won’t wear out the starter. Vehicle idle reports show which trucks idle most, so you can talk about it with the data in hand. Keep the engine running when safety or extreme weather requires it.
How GPS Fleet Tracking Helps Reduce Idle Time
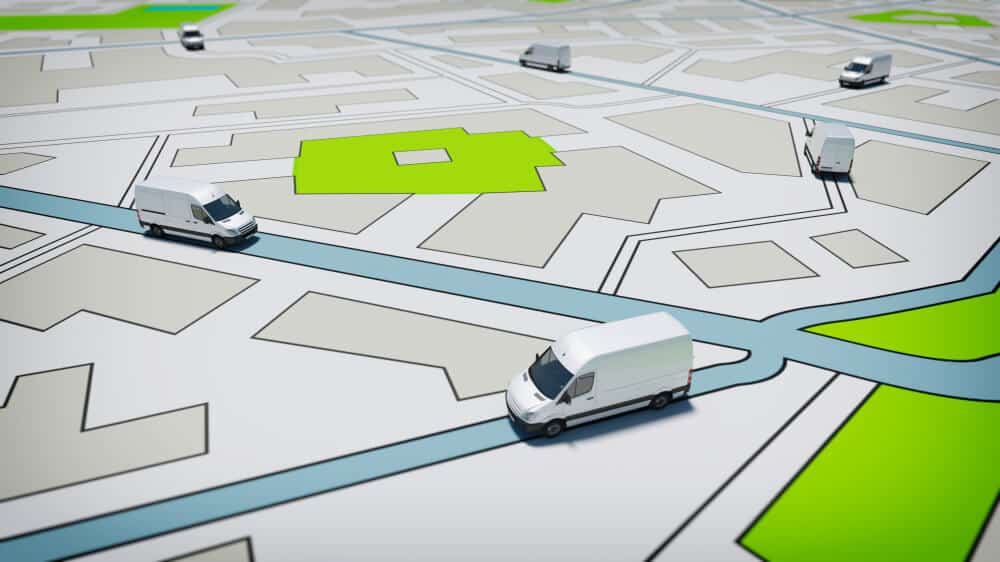
Everything above works better with data. GPS fleet tracking gives you:
- A live map of every vehicle, so dispatch decisions use real positions.
- Trip history and distance, so that you can compare planned routes with driven ones.
- Total idle time per vehicle, so that you can spot engine idling.
- Alerts when a vehicle runs outside business hours or service zones.
- Driving behavior data, such as harsh braking and speeding.
A weekly review is usually enough. Check whether the schedule caused the gaps, such as poor routing or a late cancellation, before you raise it with the technician. For a broader look at the benefits, see why you need GPS fleet tracking software and our overview of fleet tracking for field service management.
Tell your team what you track and why, and check your state’s rules on employee monitoring and notice before you start. Technicians tend to accept tracking when it’s used to fix scheduling and protect them, and resist it when it’s used only to catch them out.
Why You Shouldn’t Aim for Zero Idle Time
A schedule with no slack breaks the first time a job runs long, or traffic backs up. Because worst-day travel times keep rising, as the TTI figures above show, leave a small buffer in the day for emergency calls and overruns. The goal is to remove avoidable idle time, such as parts runs, no-shows, and poor routing, while keeping enough room to absorb real surprises.
If you run a growing team, our guide to field service software for businesses with 5 to 20 technicians explains when a shared calendar is no longer enough.
Frequently Asked Questions About Technician Idle Time
A few questions come up often when owners start looking at idle time.
What is technician idle time?
Technician idle time is paid time that a technician doesn’t spend on productive work. It includes gaps between jobs, waiting at a job site, parts runs, and admin. It’s separate from vehicle idling, which is an engine running while stopped. For more on how scheduling affects both, see our overview of what field service management is.
How do you calculate technician utilization?
Divide billable hours by total hours paid for the same period, then multiply by 100. A technician paid for 40 hours with 28 billable hours has a utilization rate of 70%. Our HVAC business management guide explains how to use the number.
What is wrench time?
Wrench time is the share of a technician’s workday spent doing hands-on work on the job. Drive time, waiting, and admin all count against it, so it’s usually lower than utilization. Raising it means cutting the idle time described in this guide.
How much idle time is normal?
There’s no reliable industry-wide figure, and numbers quoted online vary widely without a traceable source. Measure your own baseline for two weeks, then improve on it. Utilization will also differ by trade, service area, and the share of your work that is emergency calls. Our booking rate guide shows how to check whether your schedule is full enough to compare fairly.
Does GPS tracking reduce idle time?
It helps by showing where time goes. Live location improves dispatch decisions, trip history shows where routes go wrong, and idle reports show when engines are idling. The savings come from the changes you make using that data. See how GPS Fleet Tracking works inside Service Fusion.
How much does GPS fleet tracking cost?
GPS Fleet Tracking is an optional add-on to Service Fusion’s field service management software, so it’s priced separately from the base plan. Check the pricing page for current details, and see our guide to field service management software costs for how add-ons fit in.
How much fuel does idling waste?
Argonne National Laboratory measured about 0.3 gallons an hour for a car and about 1 gallon an hour for a big truck. Multiply the hours your vehicles idle by those rates and by the fuel price for an estimate. A GPS explainer covers how idle reports are generated.
Is it better to idle or restart the engine?
Argonne found that idling uses more fuel than restarting, and that restarting won’t wear out the starter on a modern vehicle. Turn the engine off when you’ll be stopped for more than a short time, unless safety or weather means you shouldn’t.
How do you reduce drive time between jobs?
Group jobs by zone, sequence them as a route, dispatch the closest available technician, and keep trucks stocked so technicians don’t leave the job for parts. A scheduling tool with a map view makes this easier, and a well-trained dispatcher makes it work. See our guide to dispatch software and the dispatcher’s role.
Will technicians object to GPS tracking?
Some may at first. Explain what you track and why, use the data to fix scheduling problems rather than to blame individuals, and check your state’s rules on employee monitoring and notice. Features such as customer ETA texts also show technicians that tracking benefits them. Our post on contractor customer service covers how.
How often should I review idle time?
Weekly works for most teams. Monthly is too slow to catch a scheduling problem before it costs you a full month of wages. A field service management platform with a dashboard makes a weekly review a few minutes of work.
What should a growing service business do first?
Measure for two weeks, then fix the two or three biggest causes. Teams of 5 to 20 technicians often outgrow a shared calendar at this stage. See our guide to field service software for 5 to 20 technicians, and our post on increasing residential service operations efficiency.
Find the Gaps That Are Costing Your Team Time
Service Fusion brings scheduling, dispatch, invoicing, and GPS Fleet Tracking into the same field service management platform, so you can see where technicians are, where time is being lost, and which jobs those trips belong to.
Book a free demo to see how Service Fusion helps you reduce avoidable idle time across your team.
Article Sources
- US Bureau of Labor Statistics. Plumbers, Pipefitters, and Steamfitters, Occupational Outlook Handbook. Accessed October 9th, 2026.
- US Bureau of Labor Statistics. Heating, Air Conditioning, and Refrigeration Mechanics and Installers, Occupational Outlook Handbook. Accessed October 9th, 2026.
- Argonne National Laboratory (US Department of Energy). To Idle or Not To Idle: That Is the Question. Accessed October 9th, 2026.
- Texas A&M Transportation Institute. Traffic hits record high as commuters rewrite the rush hour. October 24th, 2025.
Related Posts
Best Field Service Software for Businesses With 5 to 20 Technicians (2026)
Continue ReadingField Service Software Data Migration Checklist
Continue ReadingStay Informed
Get the latest news and insights plus, Service Fusion offers and updates.Thank you for your submission.
SHARE